Outdoor Business Survey Report

Report

2024 Vermont Outdoor Business Survey Results Report

Summary

The 2024 Vermont Outdoor Business Survey was conducted as part of the large-scale planning process Move Forward Together Vermont led by the Department of Forests, Parks and Recreation (FPR) and the Vermont Outdoor Recreation Economic Collaborative (VOREC) Program. Survey results capture information about outdoor business operations and programs across the state. See some of the initial results below. 

If you are interested in accessing the data for the Outdoor Business Survey, please email Jackie Dagger, VOREC Program Manager at jackie.dagger@vermont.gov. Please share a description of the project for which you are planning to use the data and what data format you would prefer. Some restrictions may apply. 
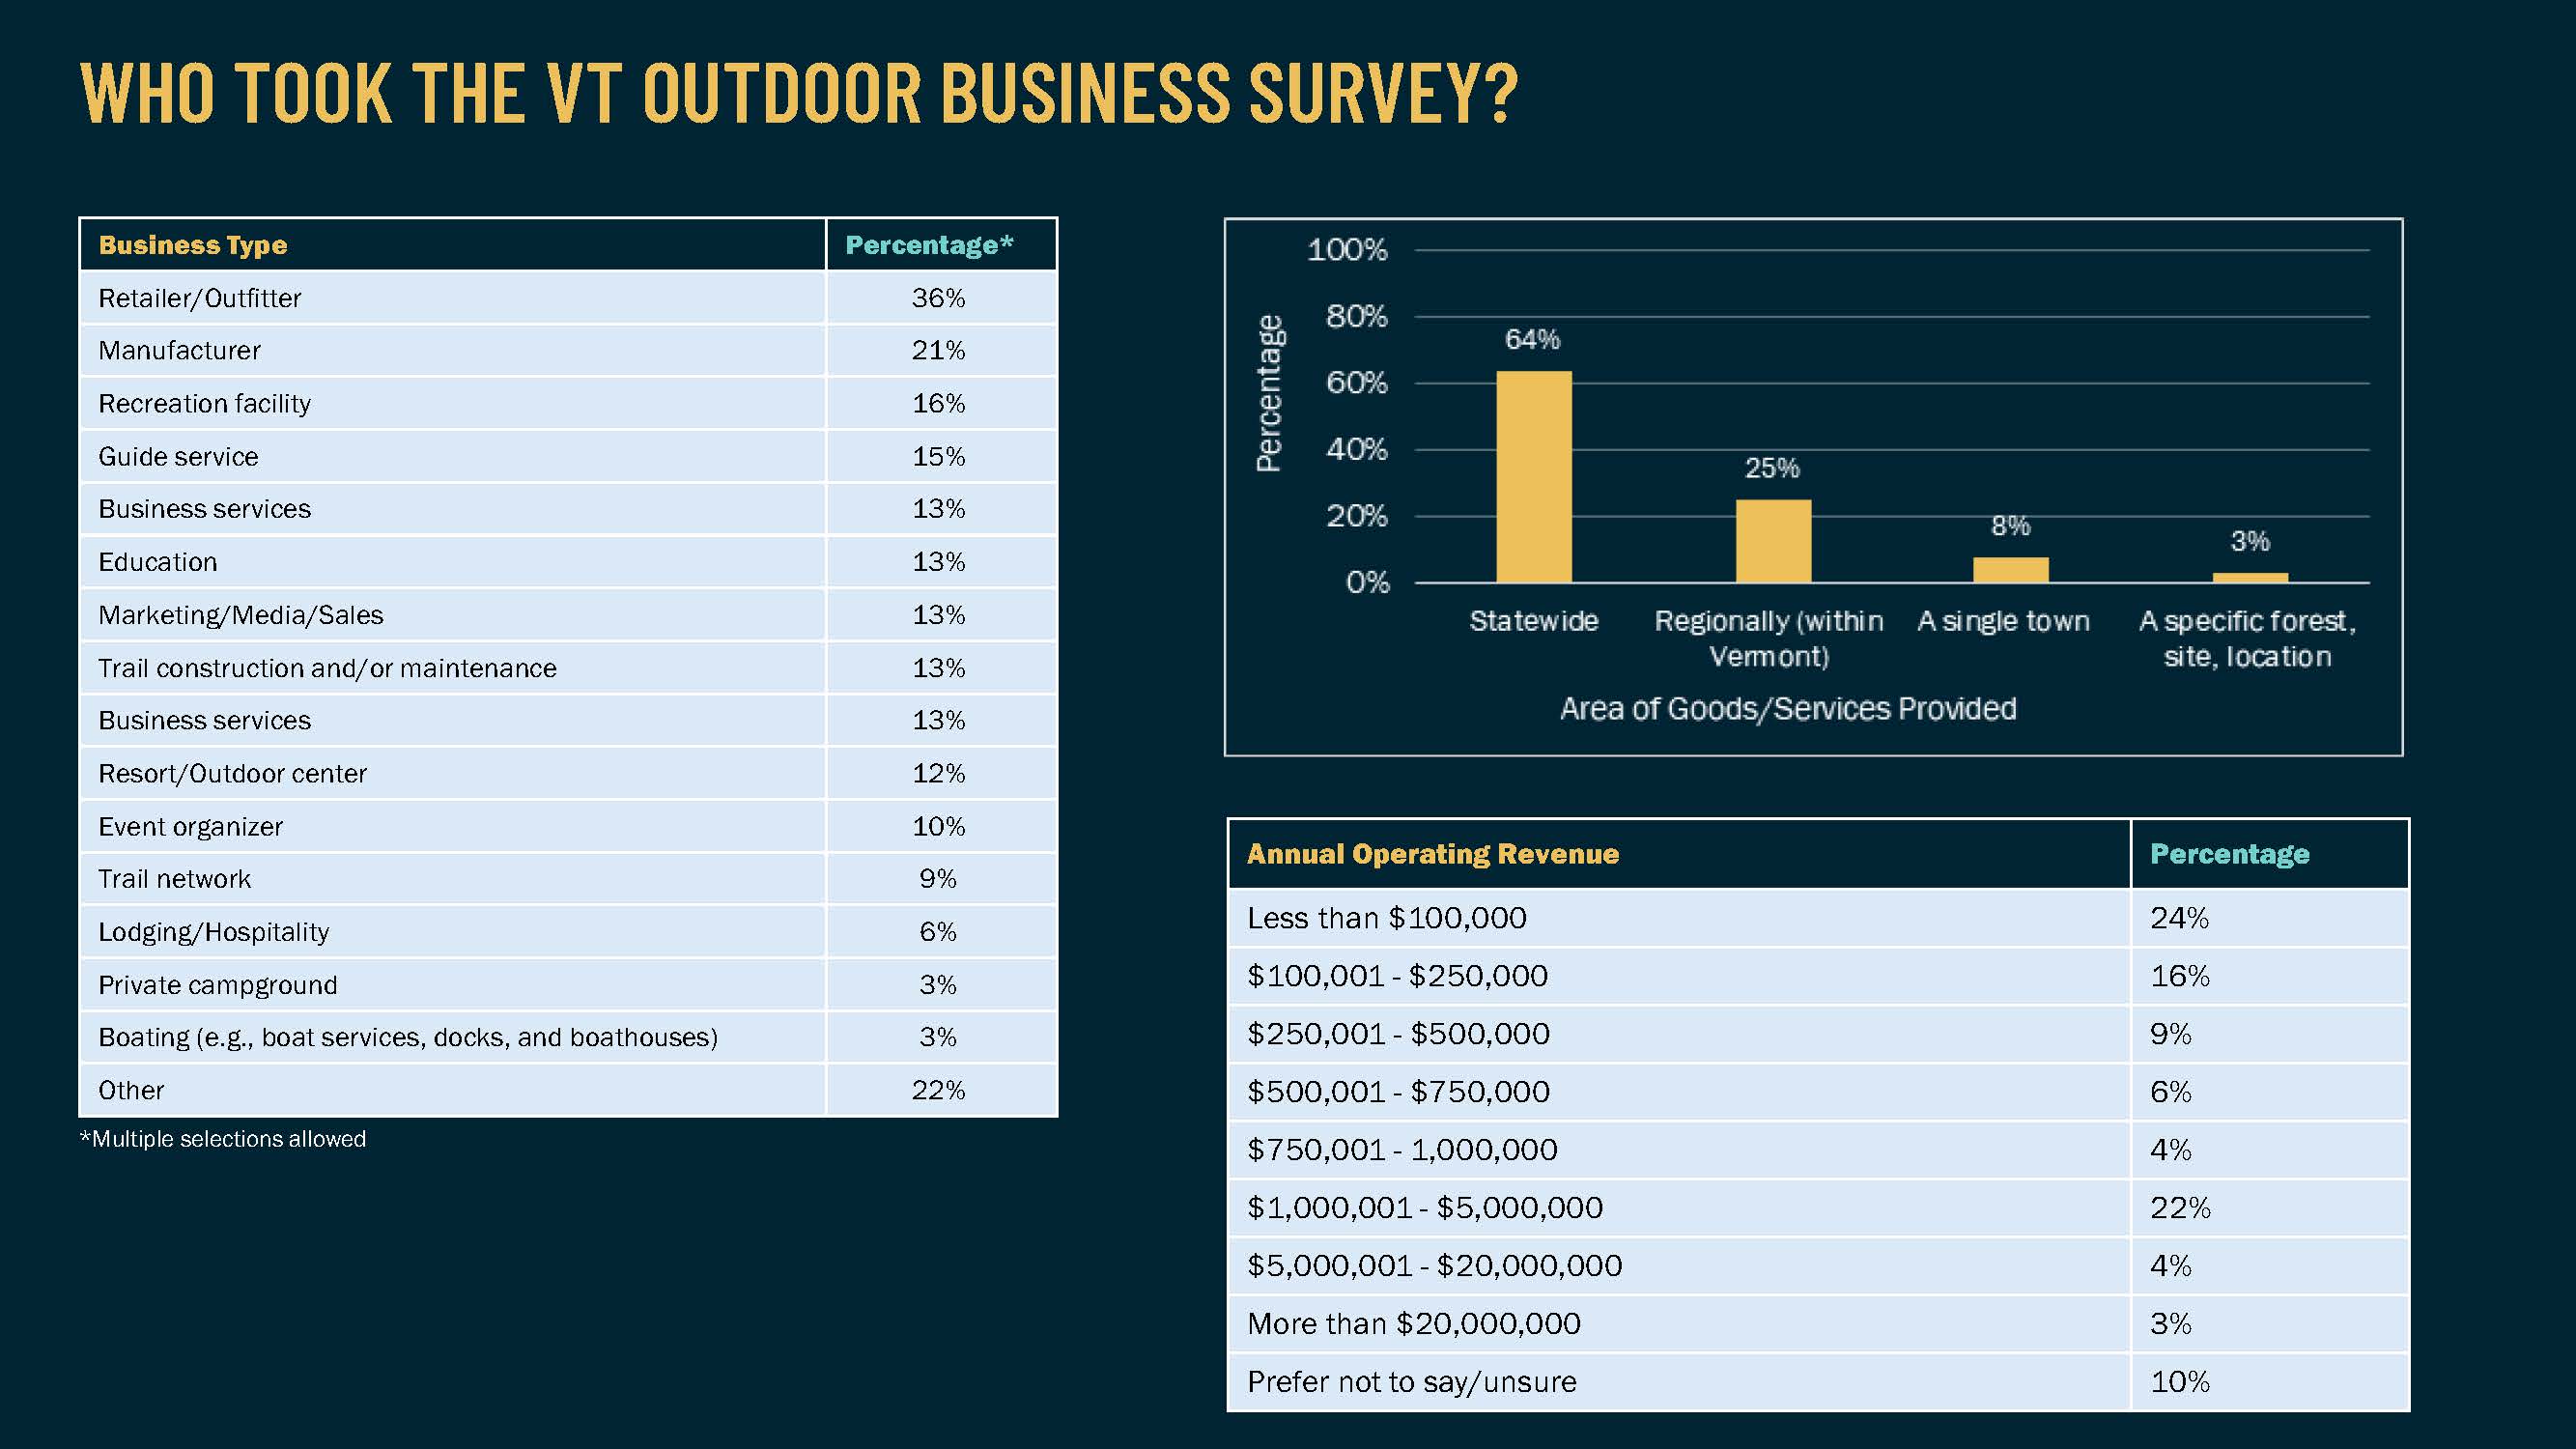
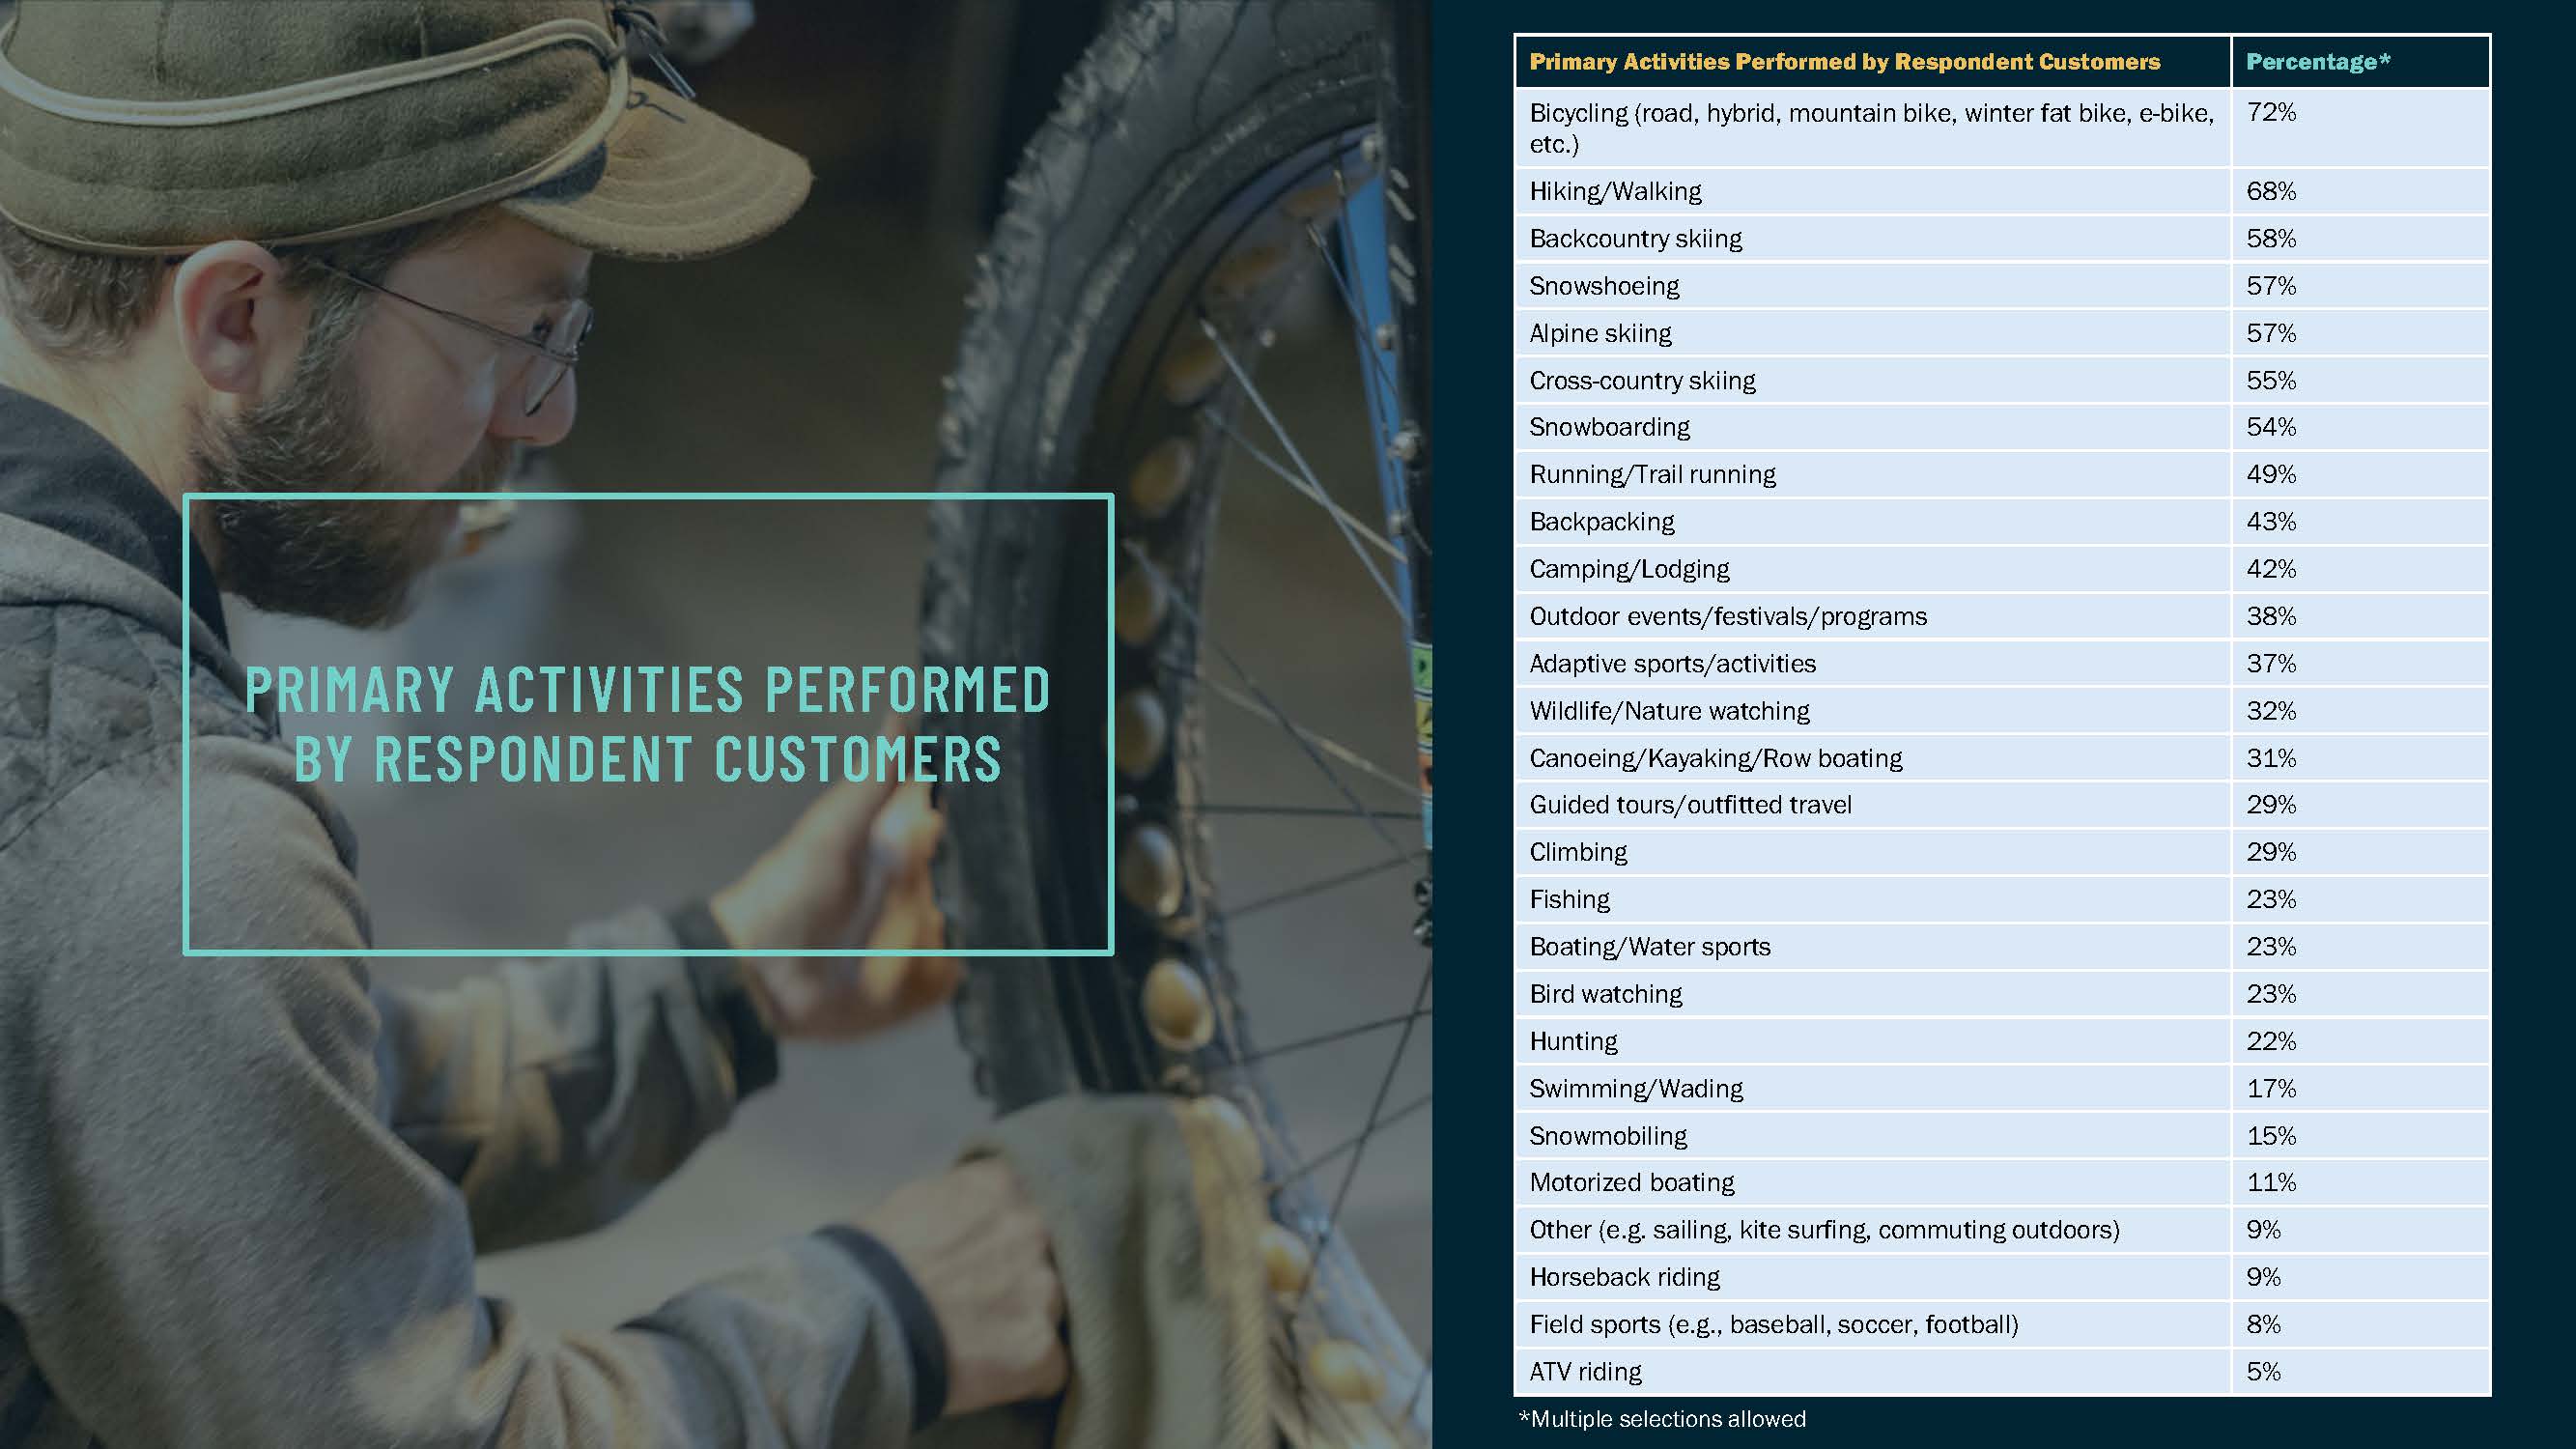
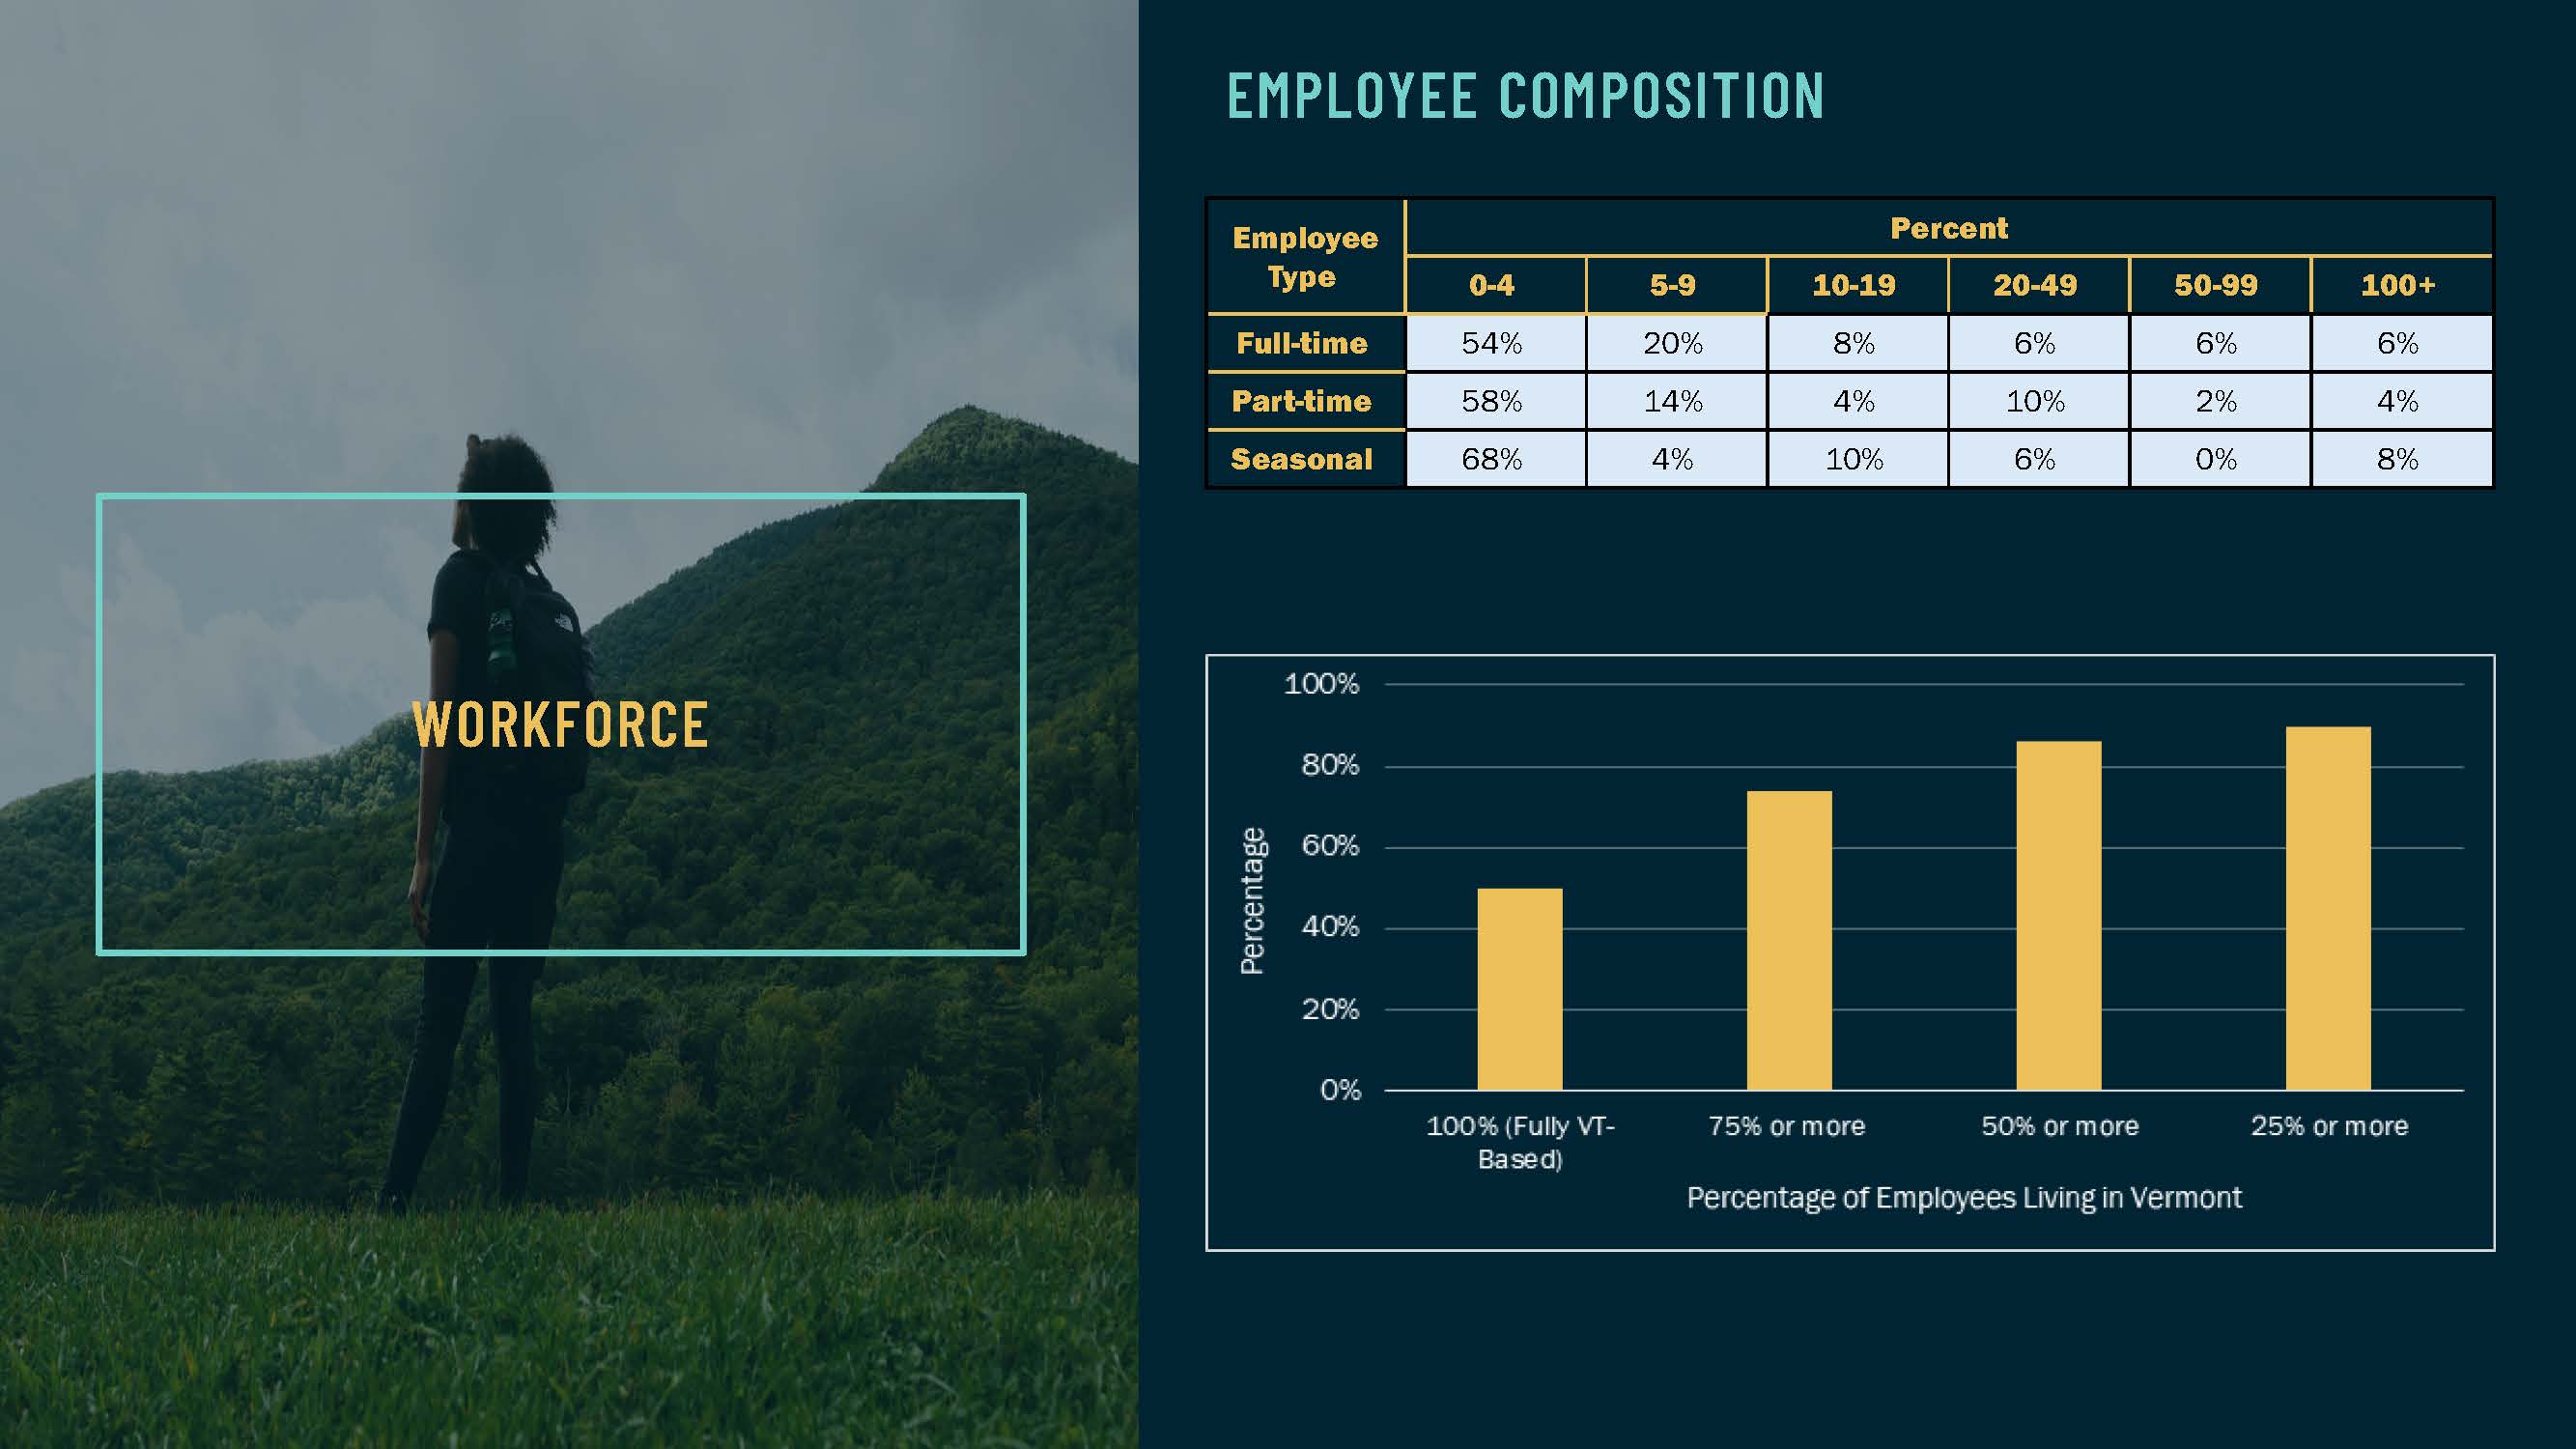
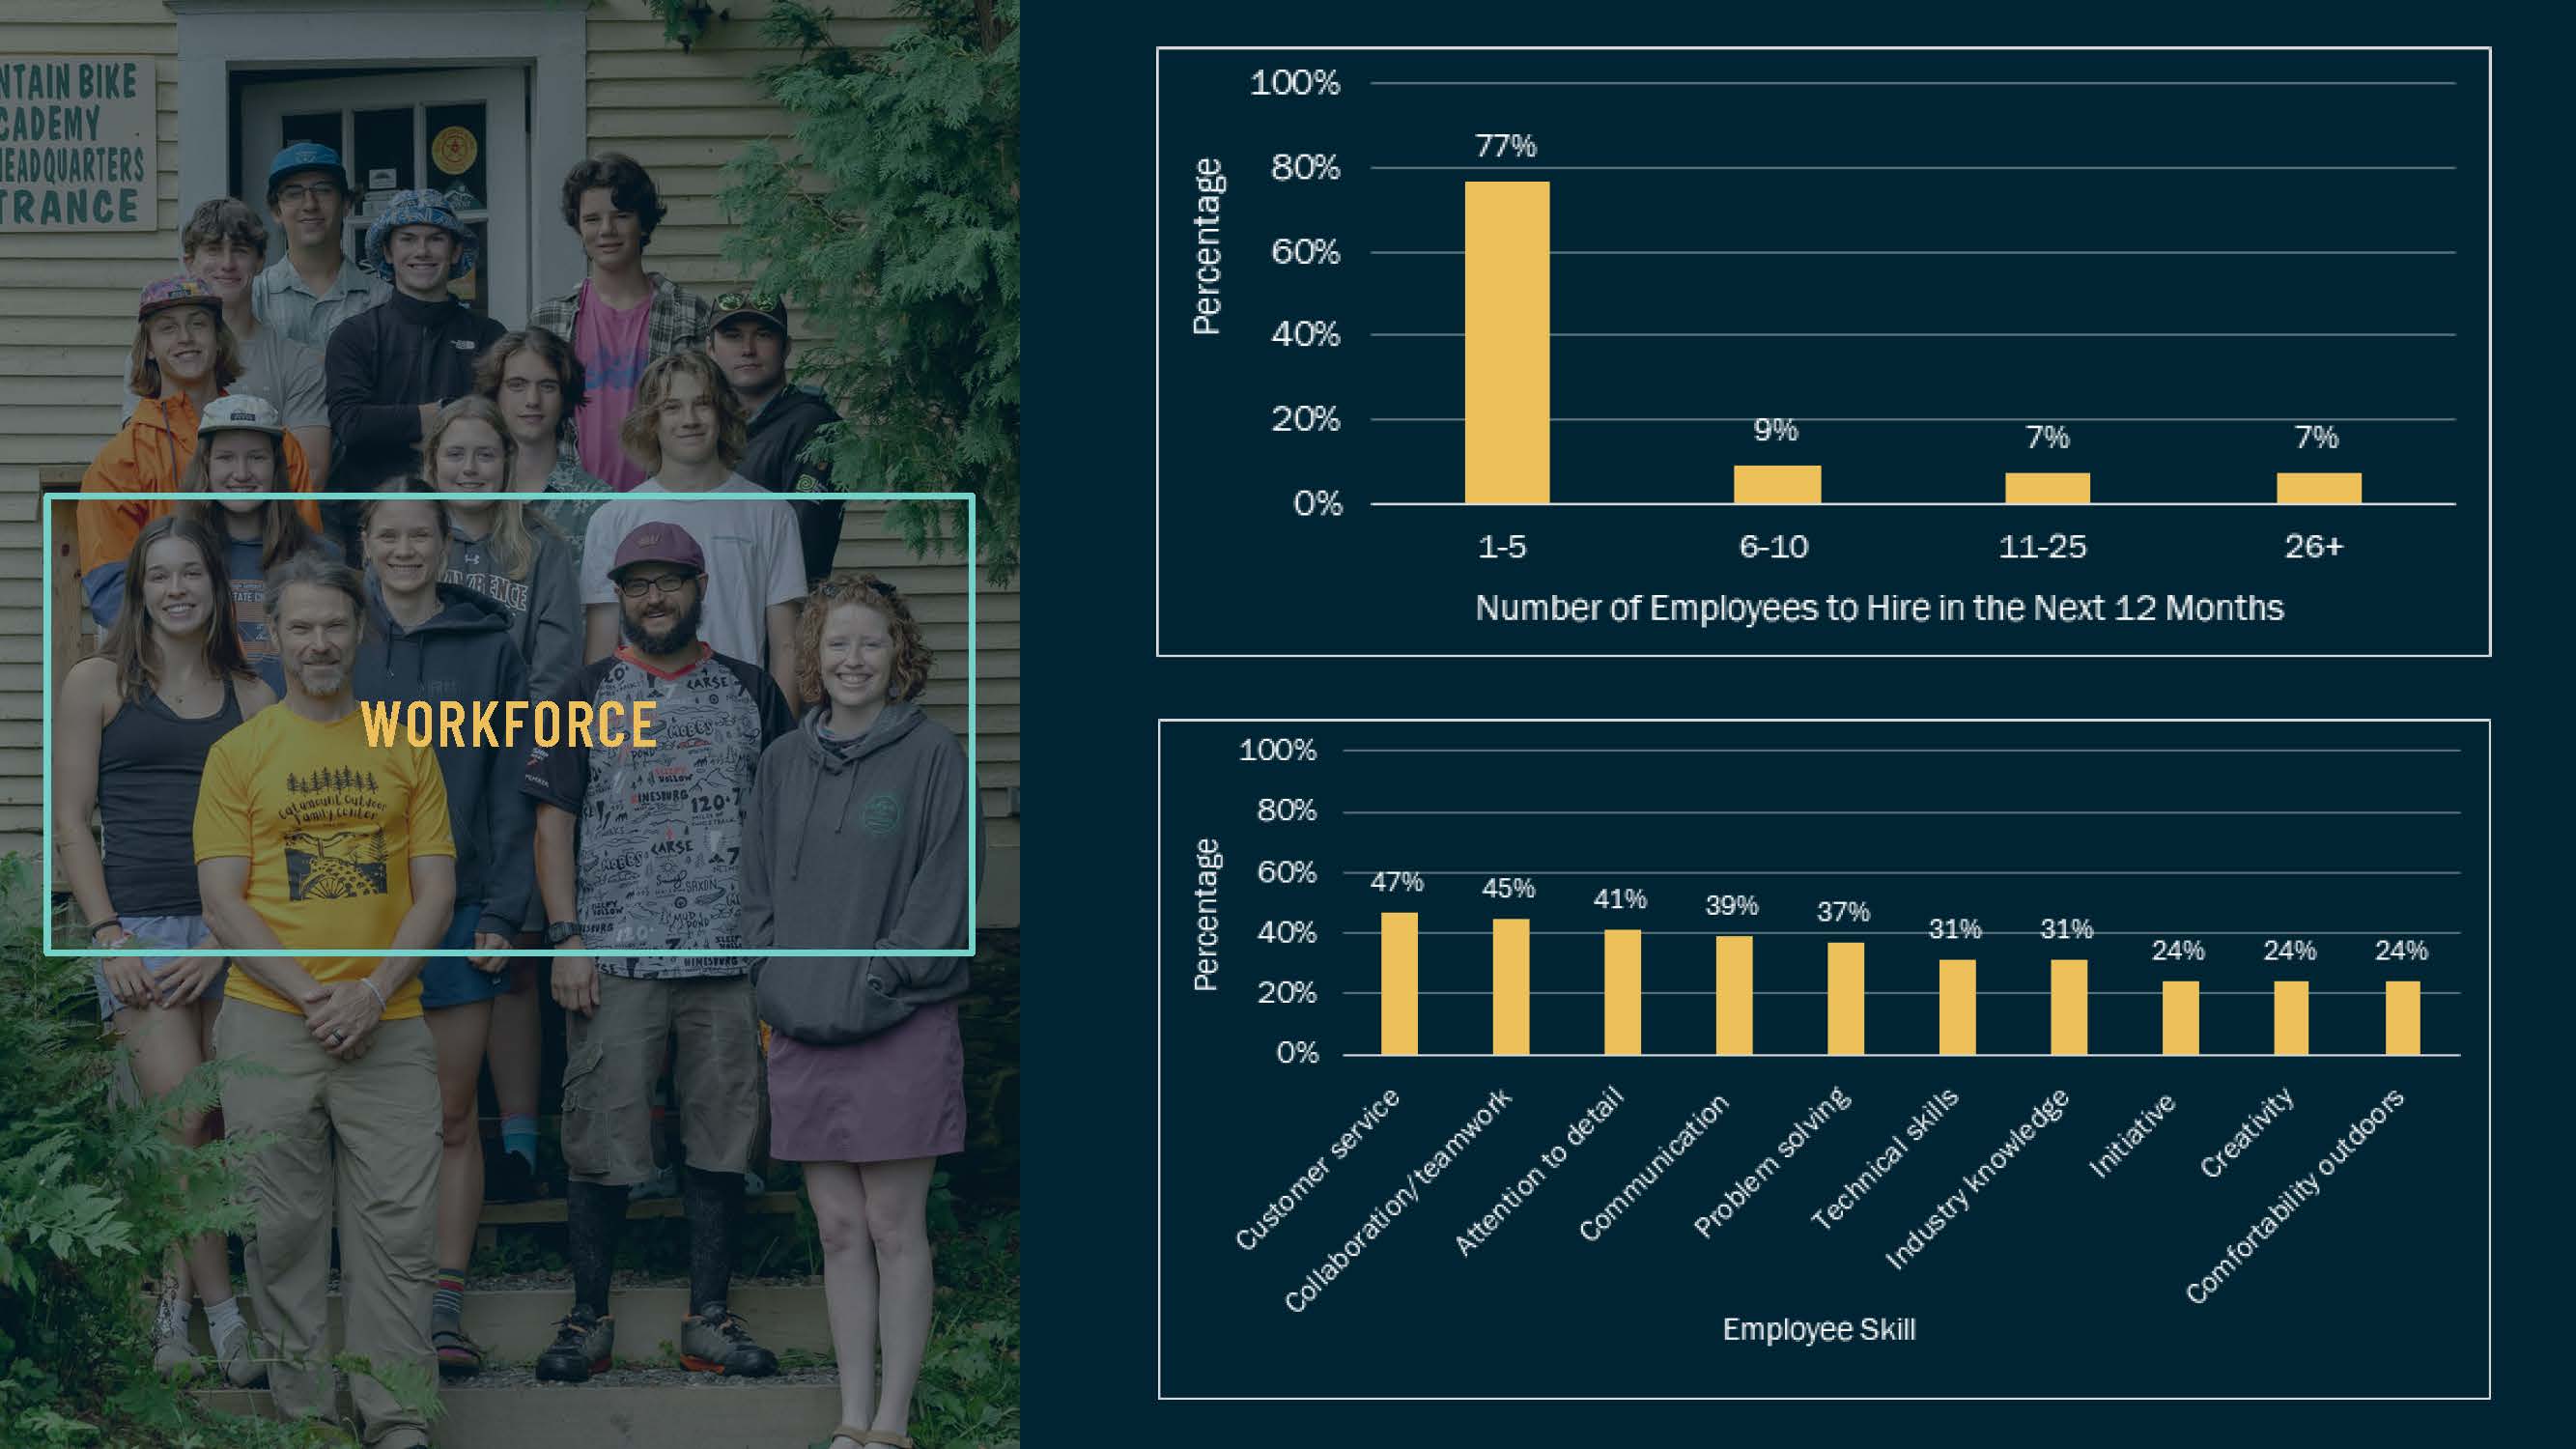
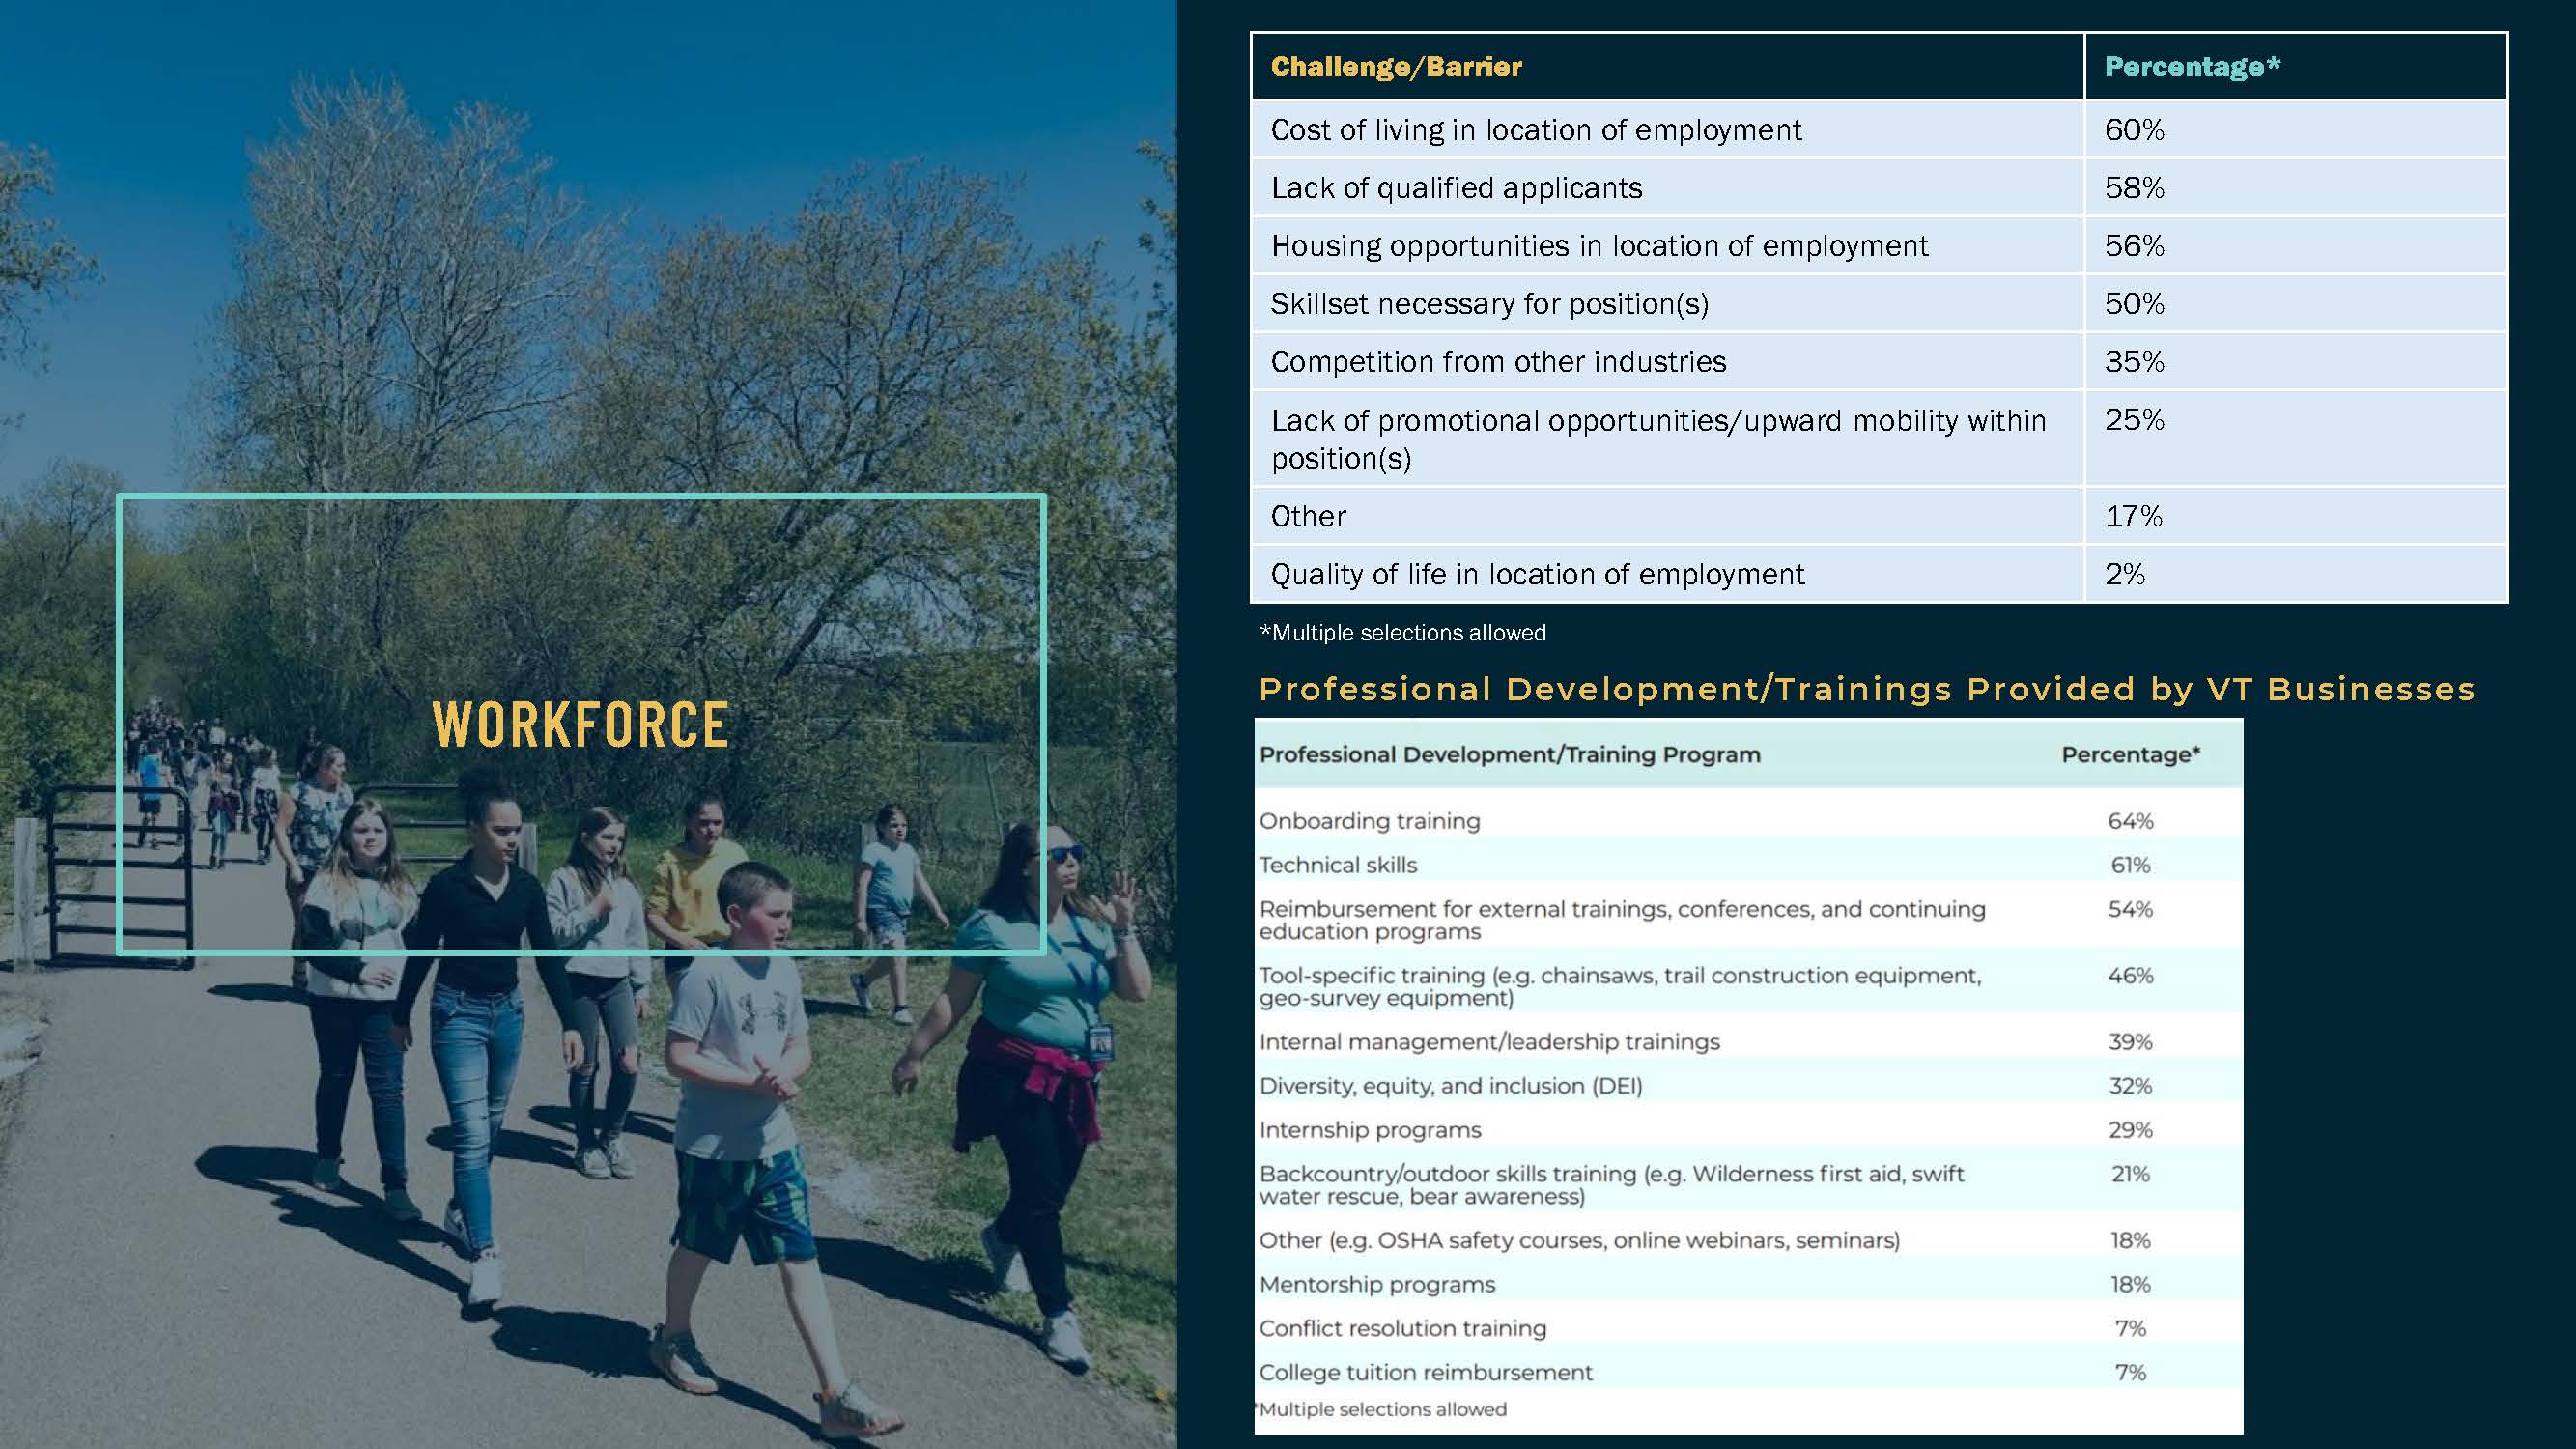
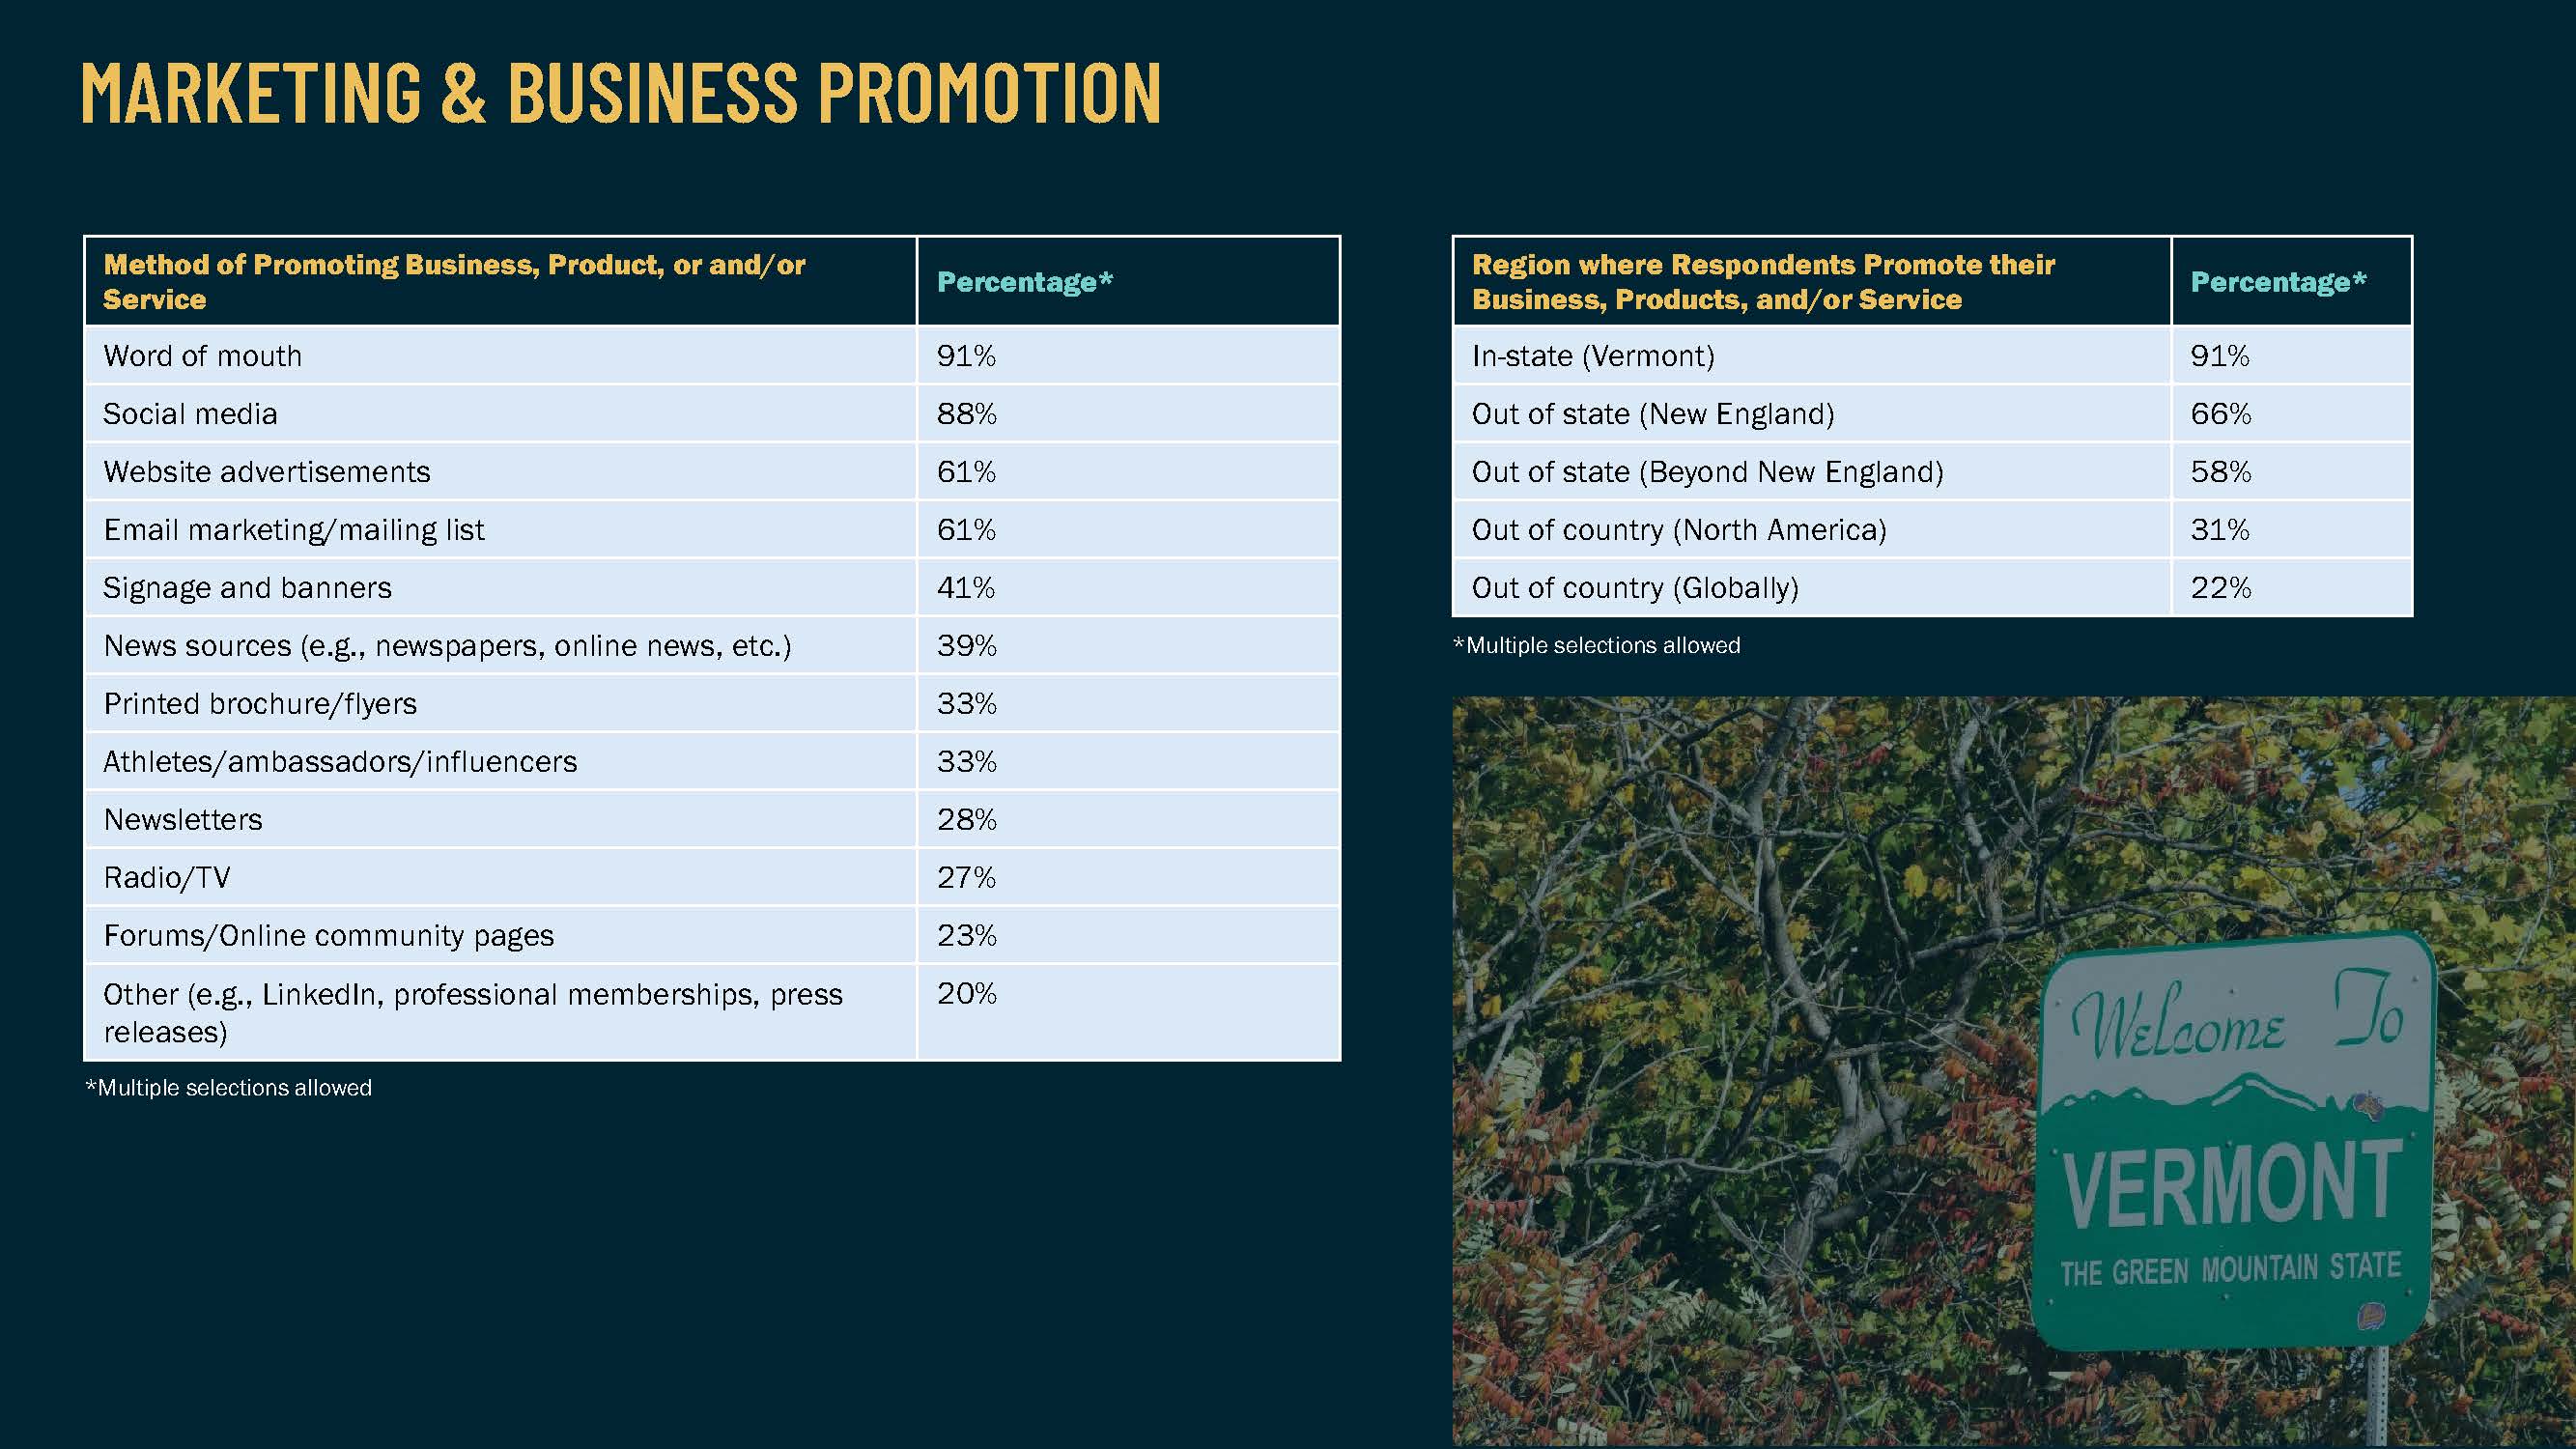
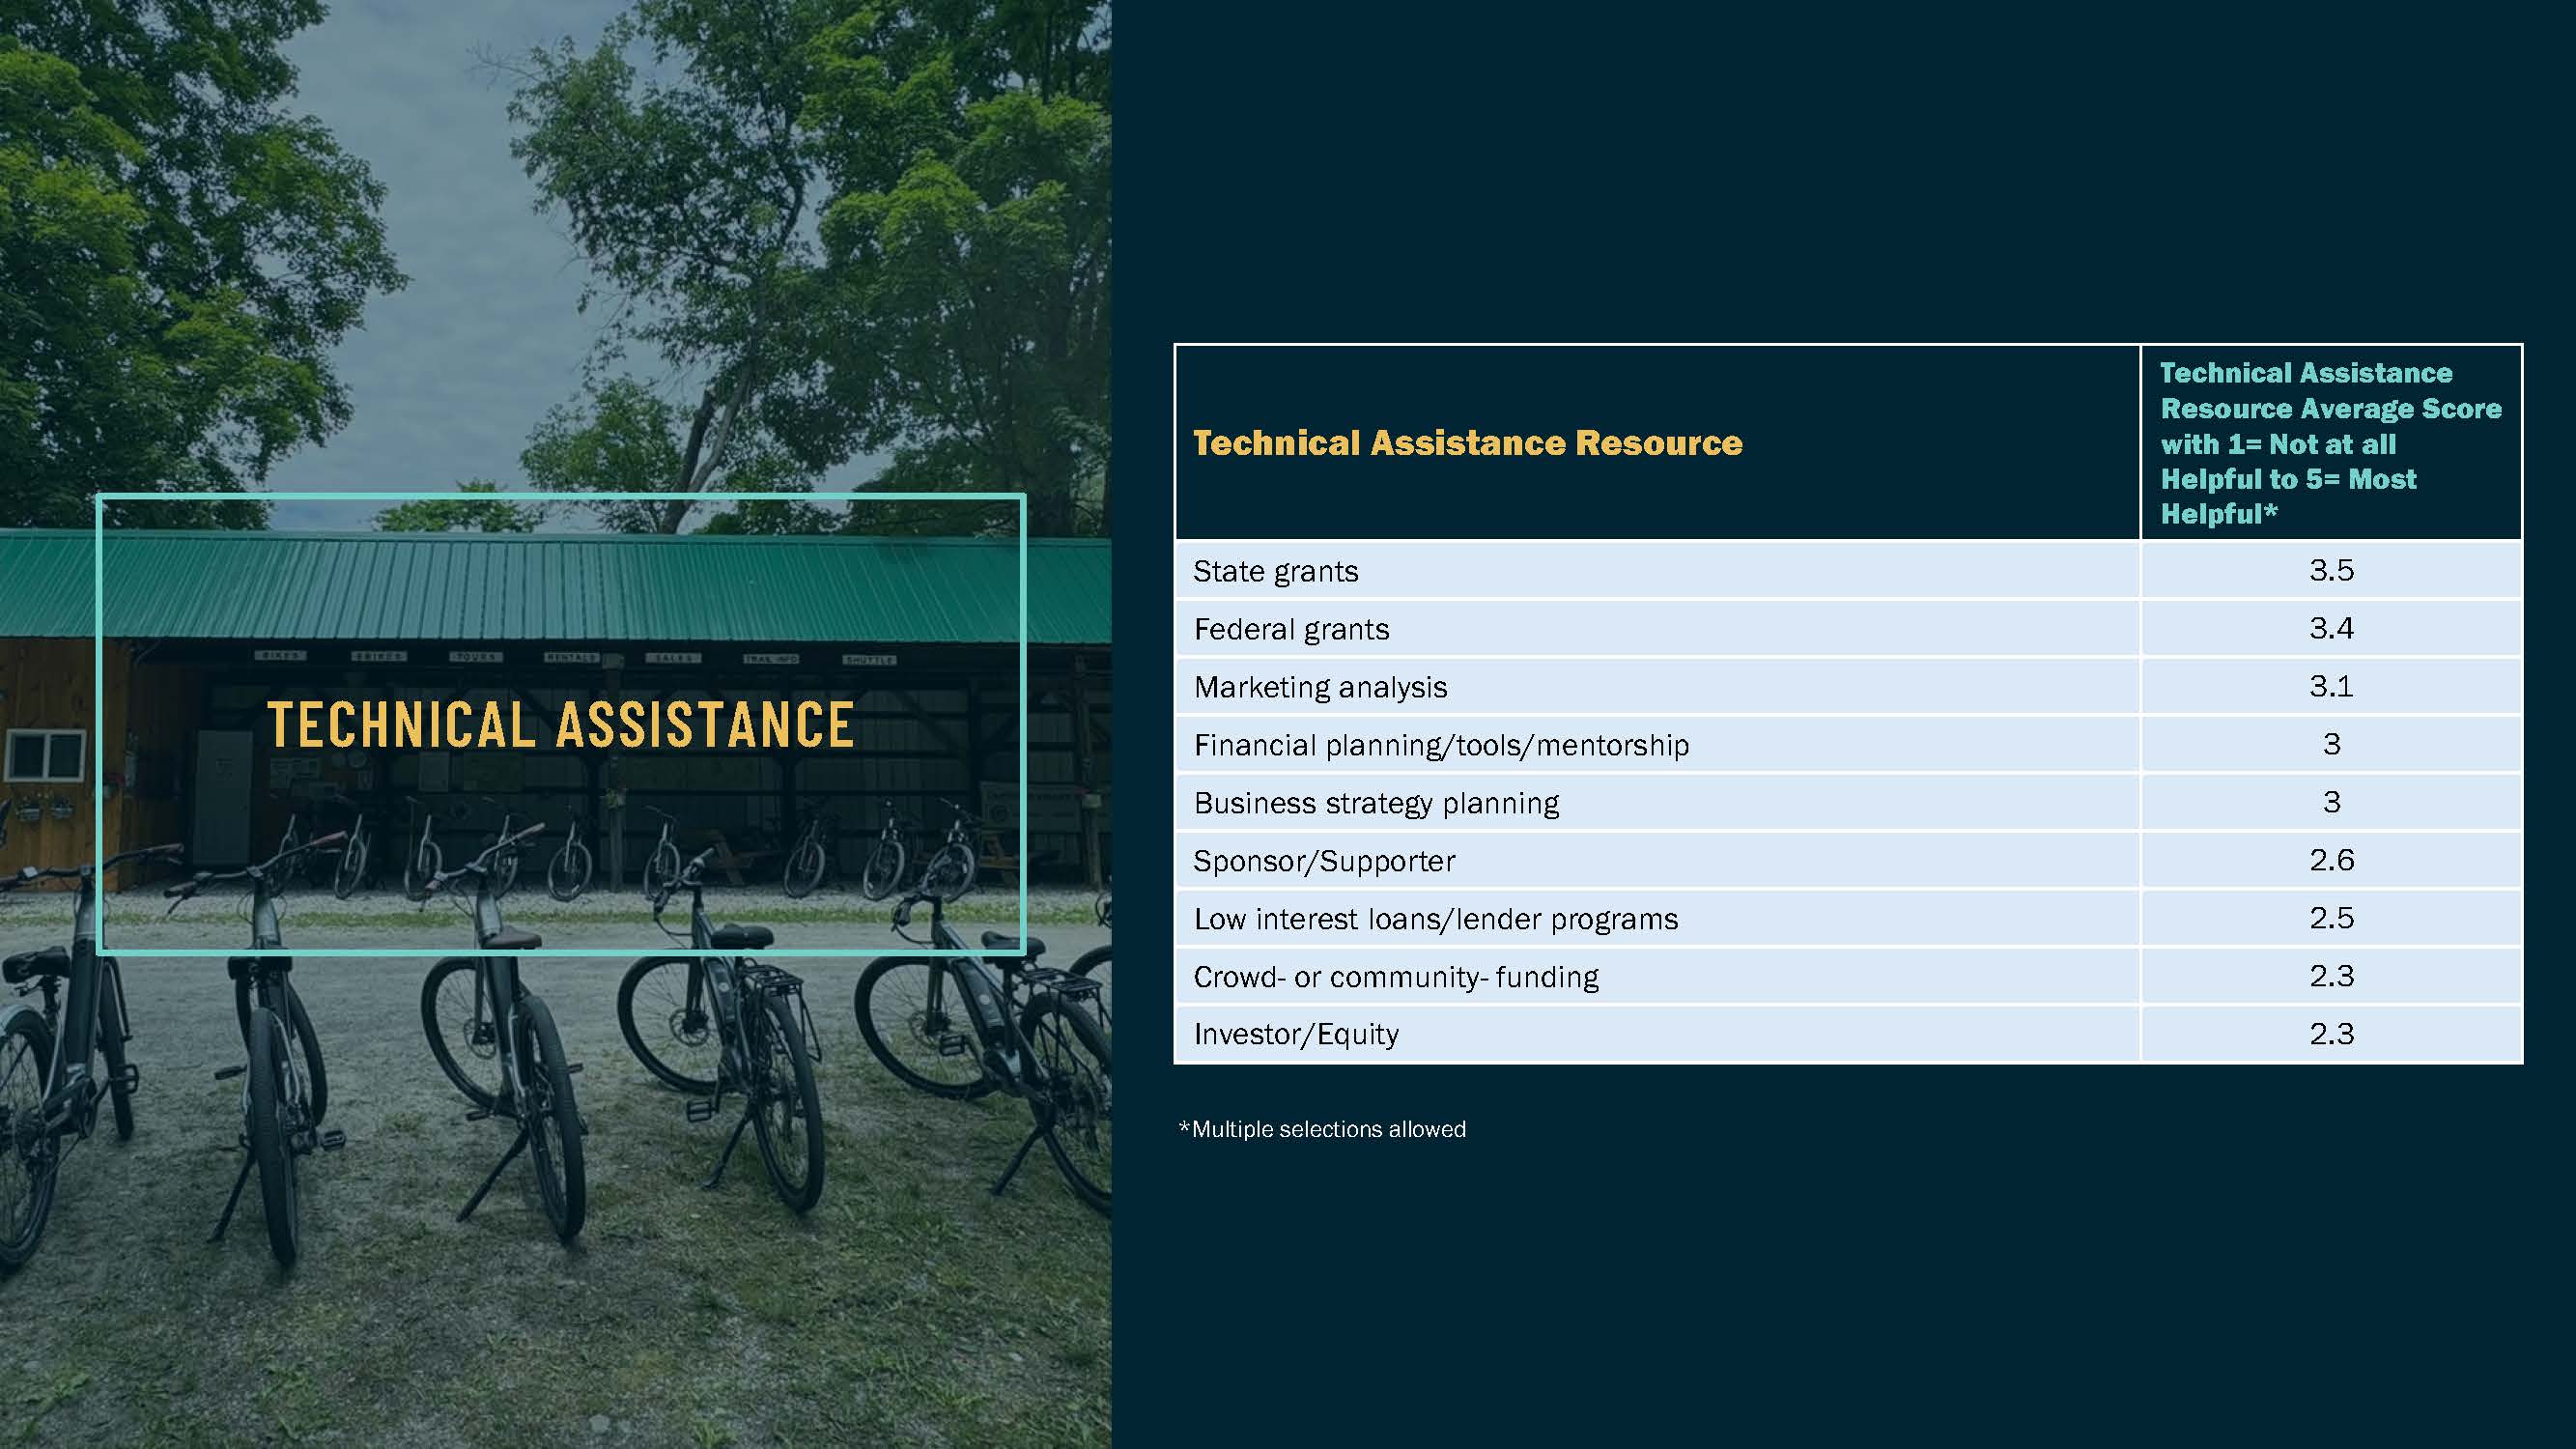
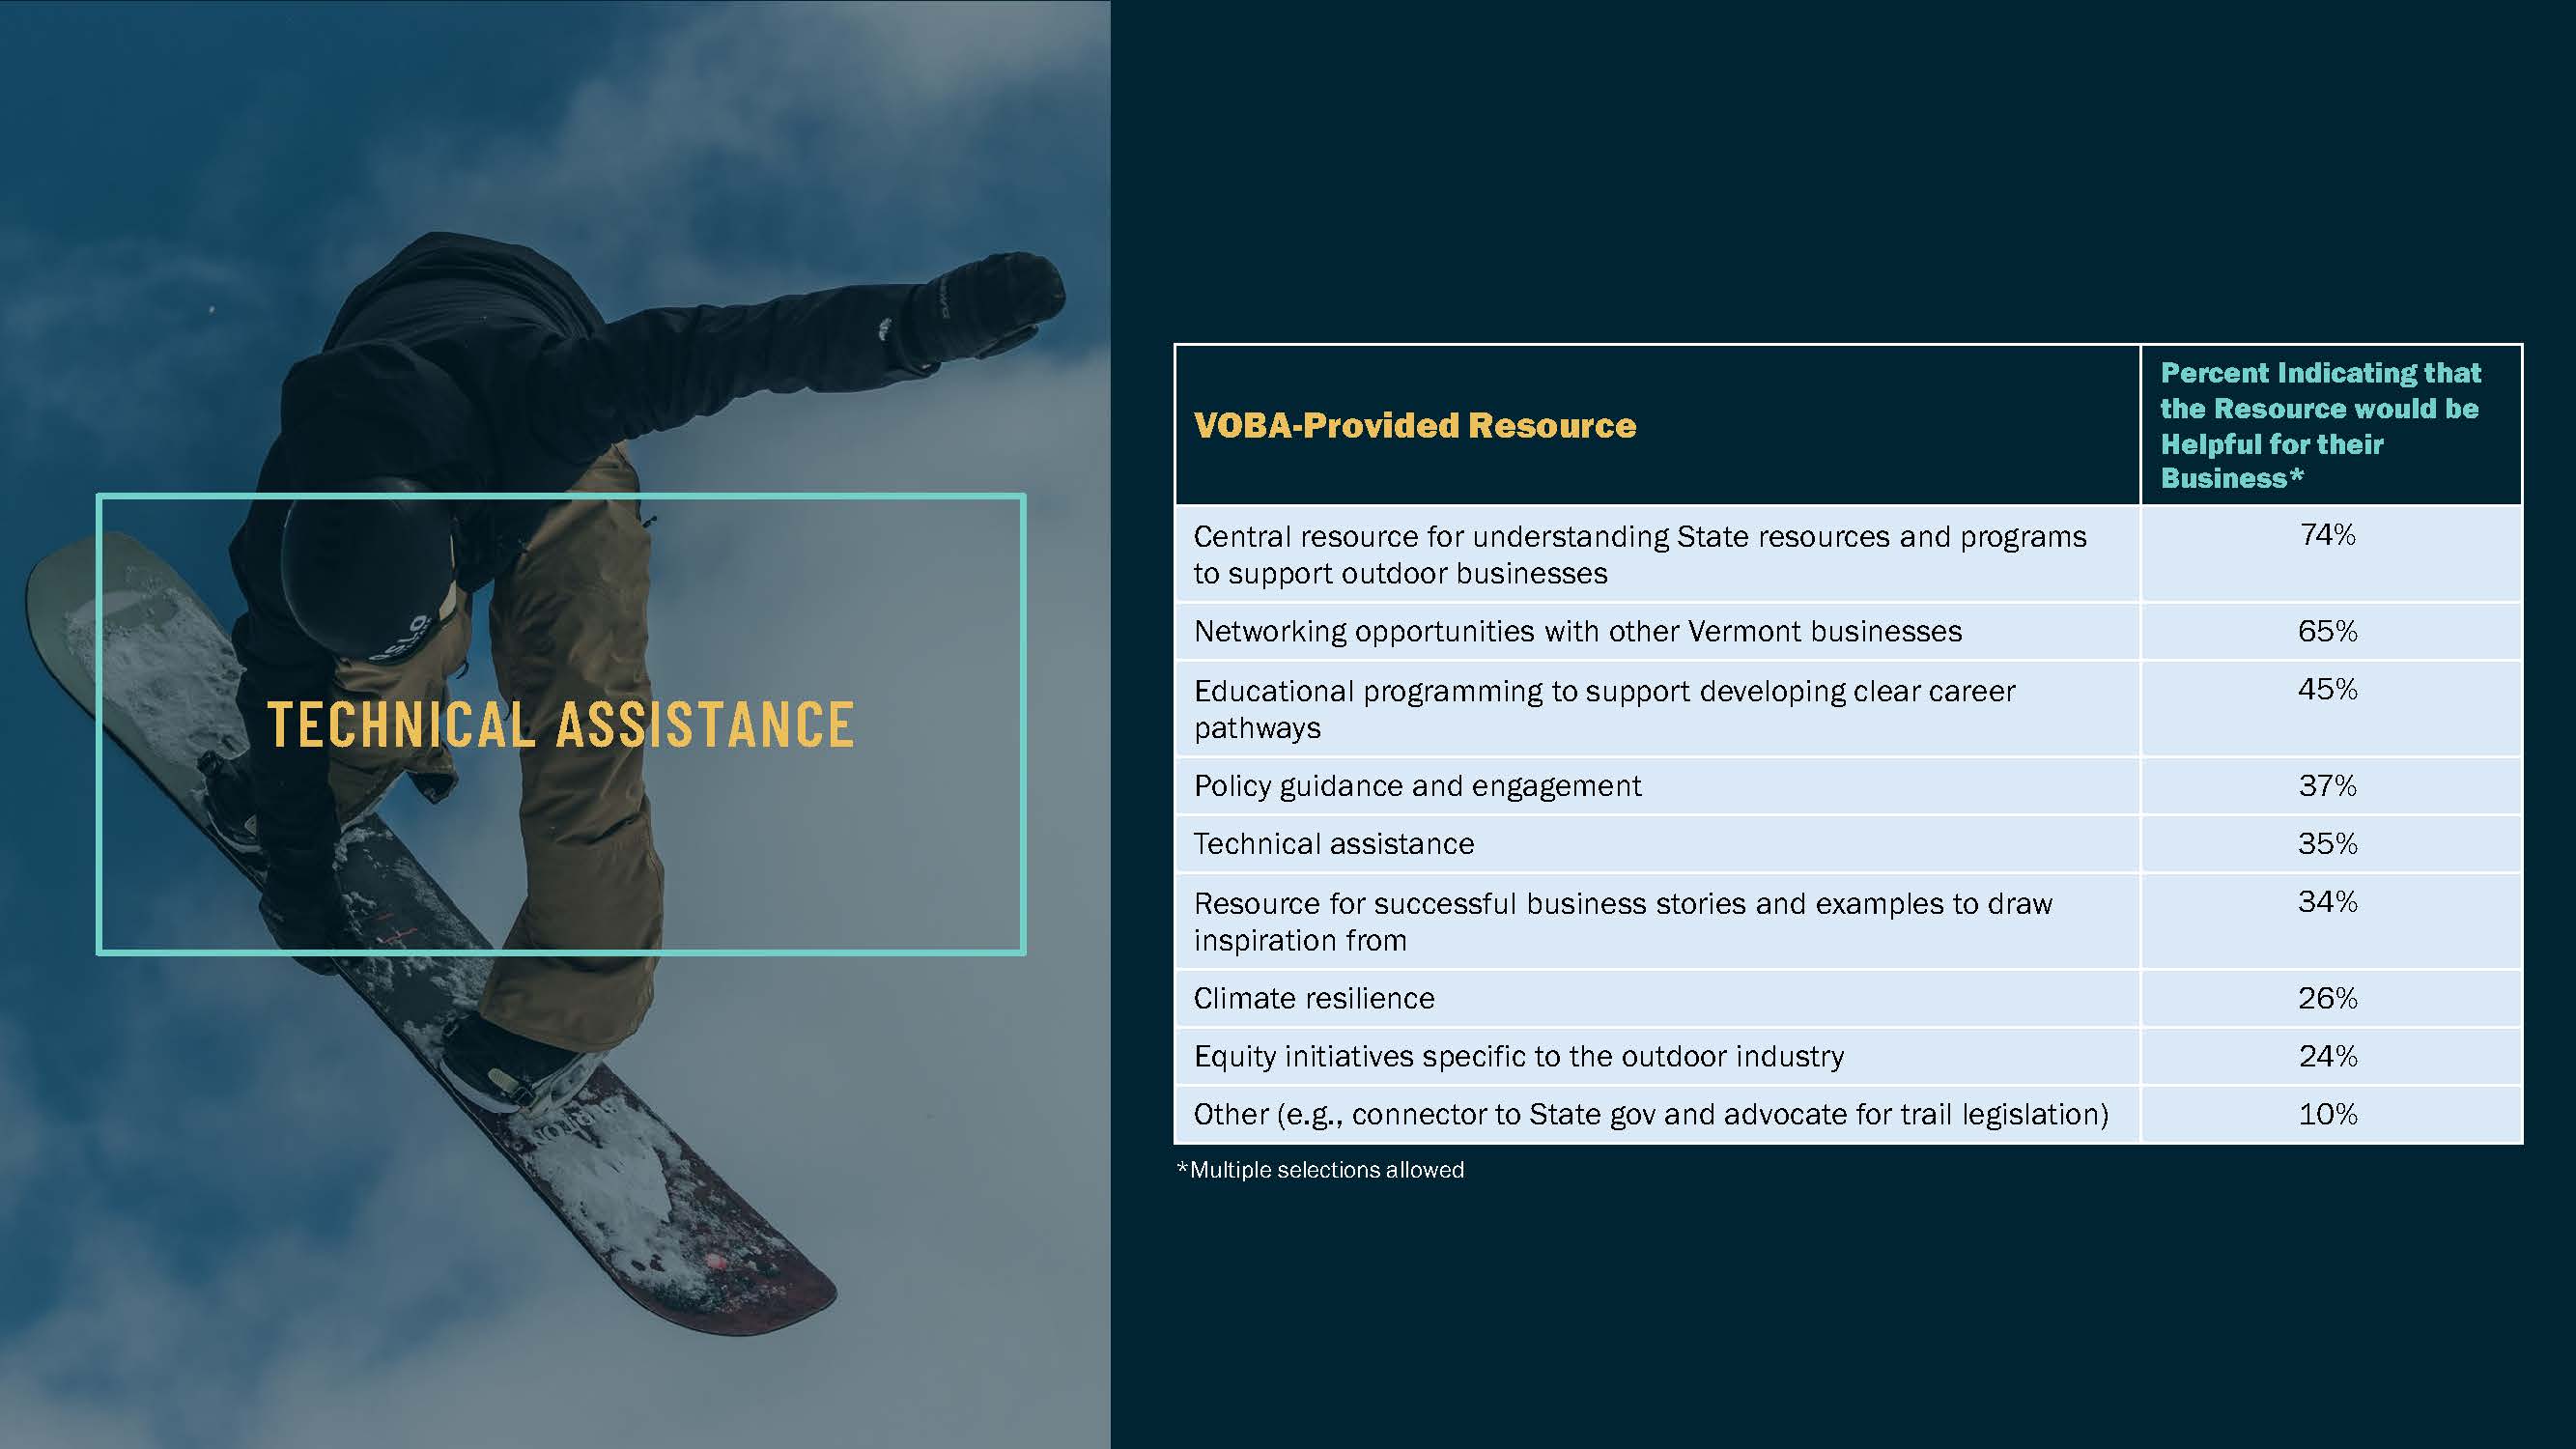
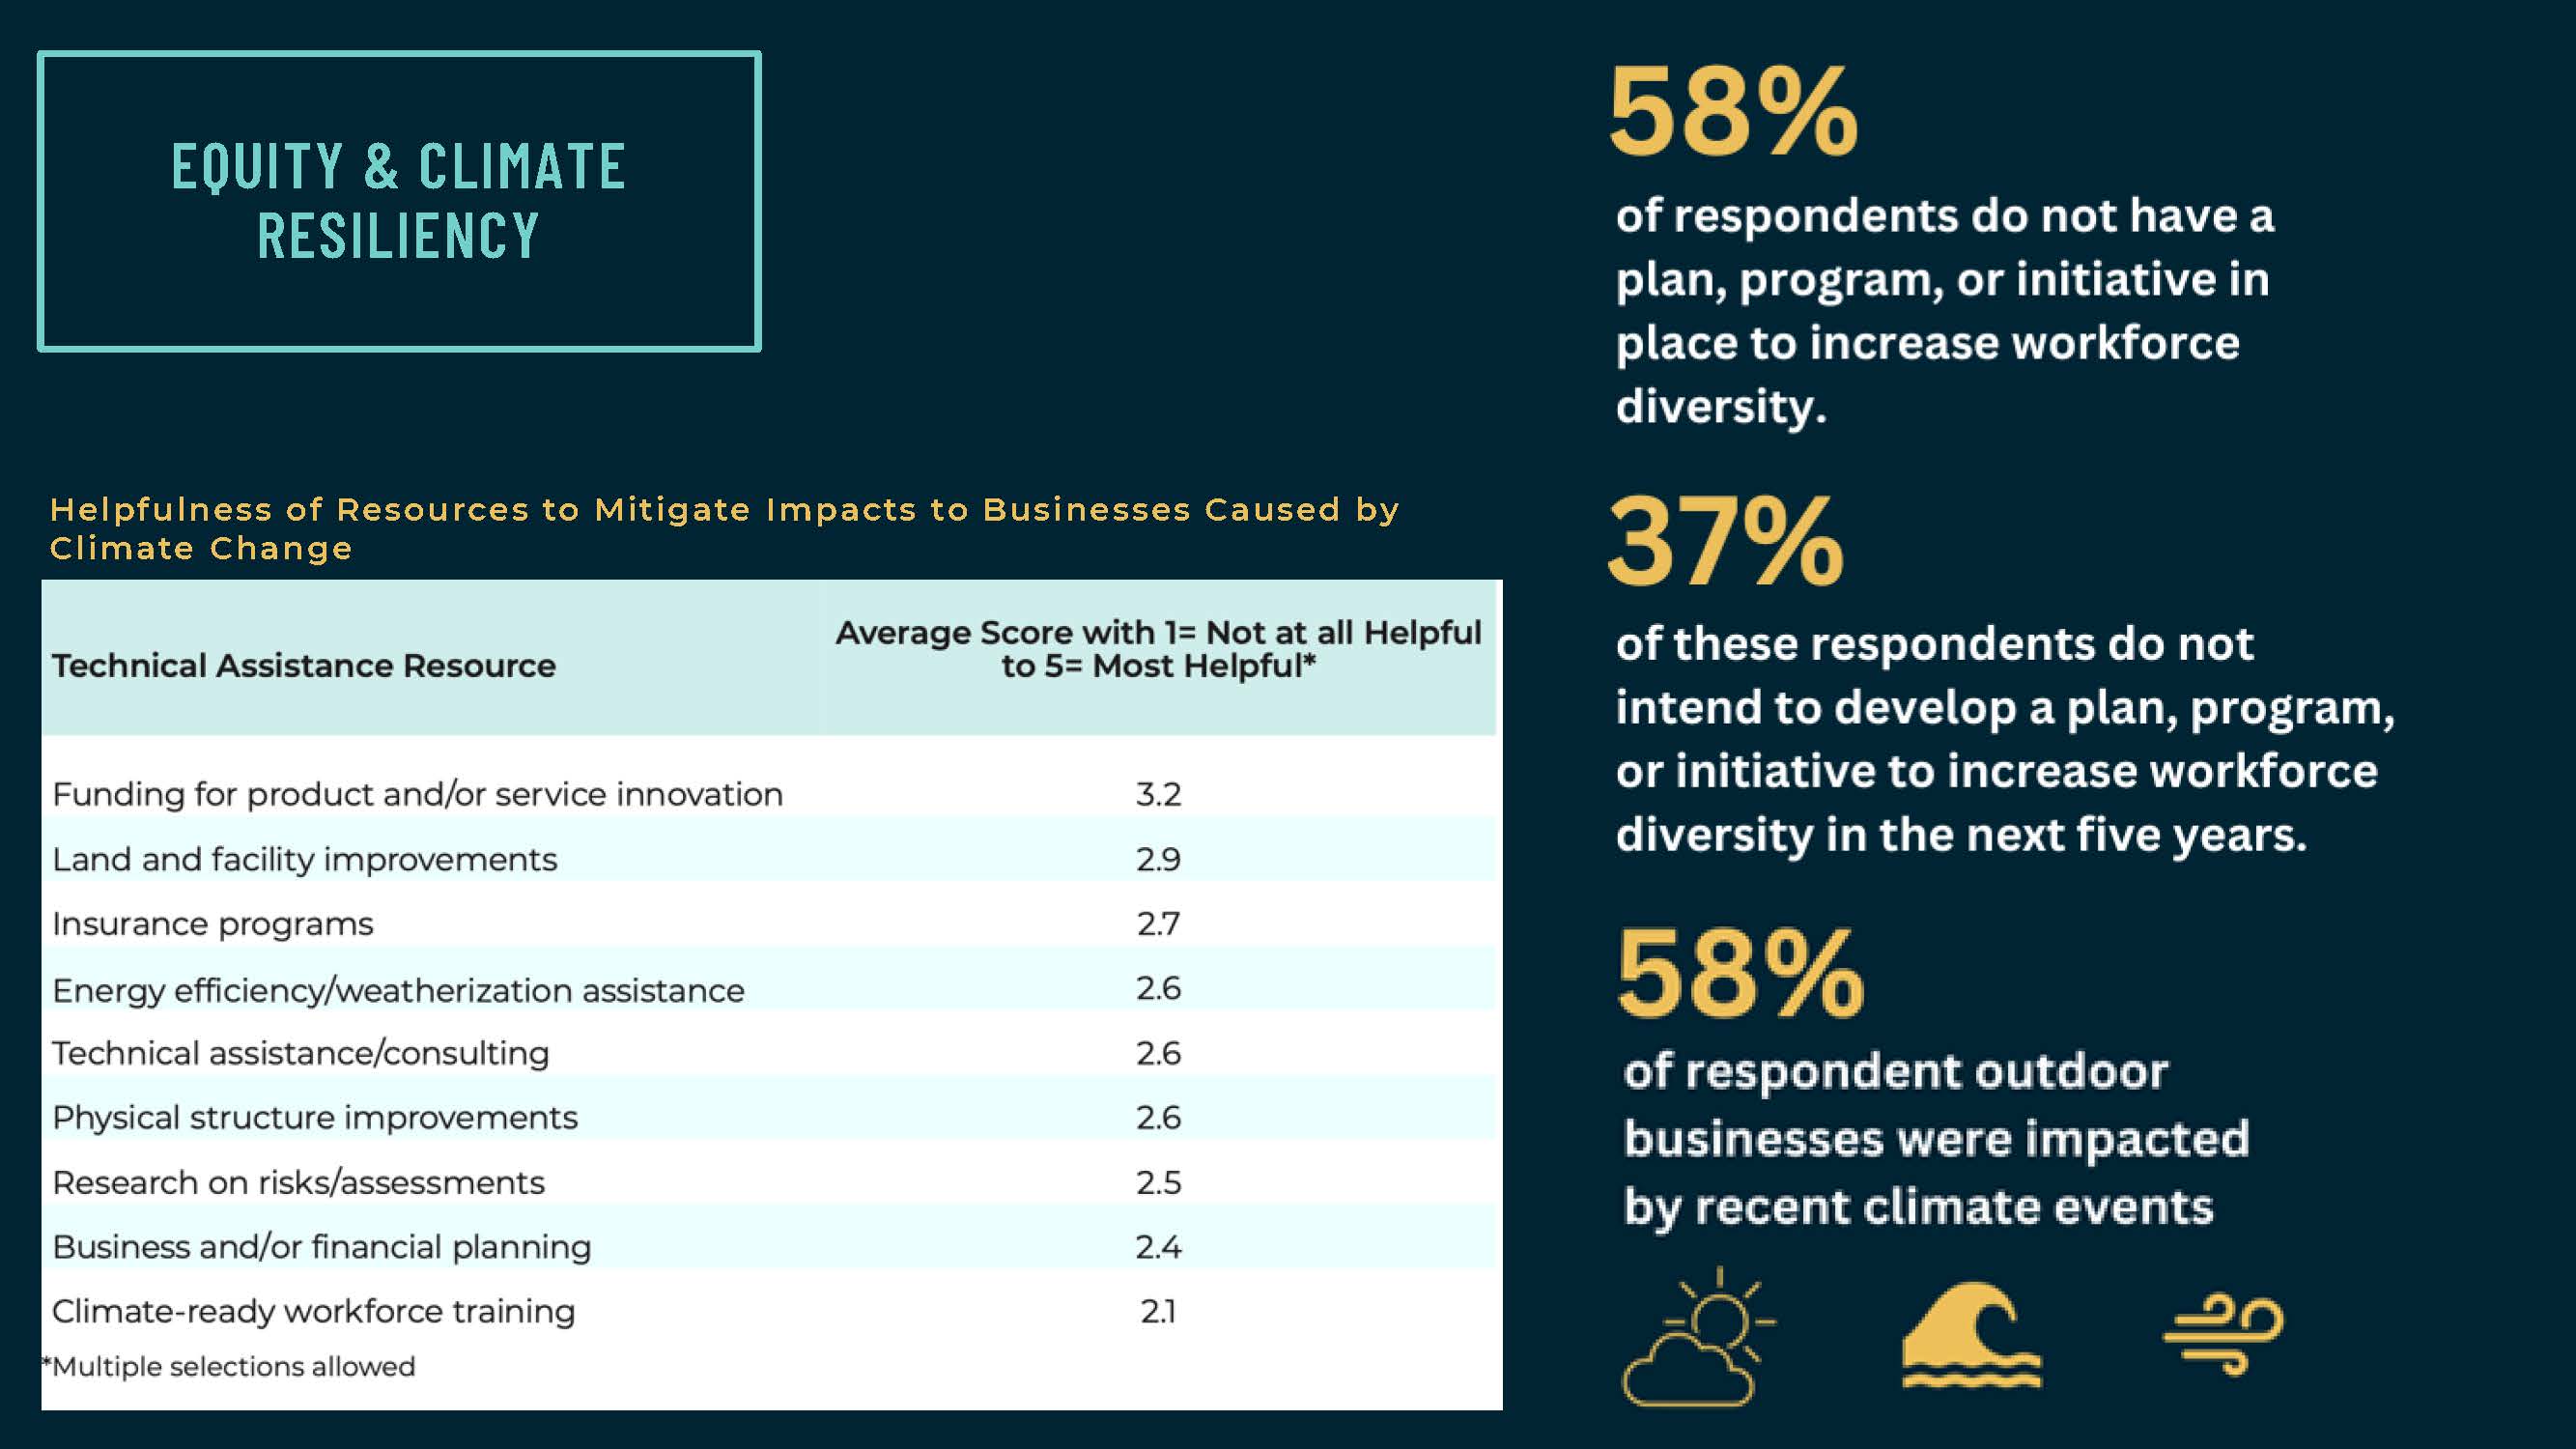
The graphic is titled "Who Took the VT Outdoor Business Survey?". The graphic contains three data tables. The first shows 16 different business types and the percentage of participants who took the survey. The second data table is a bar graph with the areas of goods/services provided on the bottom line and the percentage on the vertical line. The third data table is a table showing annual operating revenue and the percentage of participants. For more information about the data in these tables contact Jackie Dagger, VOREC Program Manager (jackie.dagger@vermont.gov)The graphic is titled "Primary Activities Performed by Respondent Customers" and contains one data table showing Primary Activities Performed by Respondent Customers and the percentage of participants. For more information about the data in this graphic contact Jackie Dagger, VOREC Program Manager (jackie.dagger@vermont.gov)The graphic is title Employee Composition and contains two data tables. The first table shows the employee type (Full-time, part-time, seasonal) and the percent of participants with employees of those types. The second table is a bar graph with the percent of employees living in Vermont on the bottom and the percentage of employees on the vertical line. For more information about the data in this graphic contact Jackie Dagger, VOREC Program Manager (Jackie.dagger@vermont.gov). The graphic is titled Workforce and contains two data tables. The first table is a bar graph showing the number of employees to hire in the next 12 months versus the percentage of participants in the survey. The second table is a bar graph showing employee skill versus percentage of participants in the survey. For more information on the data in these tables contact Jackie Dagger, VOREC Program Manager, jackie.dagger@vermont.govThe graphic is titled workforce and contains two data tables. The first data table shows the challenges/barriers versus the percentage of survey participants. The second table shows the professional development/training program versus the percentage of survey participants. For more information about the data in this graphic contact Jackie Dagger, VOREC Program Manager, jackie.dagger@vermont.govThis graphic is titled Marketing and business promotion and contains two data tables. The first table shows the method of promoting business, product, and/or service versus the percentage of survey participants. The second table shows the region where respondents promote their business, products and/or service versus percentage of survey participants. For more information about the data in this graphic contact Jackie Dagger, VOREC Program Manager, jackie.dagger@vermont.gov.This graphic is titled technical assistance and contains one data table. The table shows technical assistance resources against the overall average score it received from survey participants. For more information about the data in this table contact Jackie Dagger, VOREC Program Manager, jackie.dagger@vermont.govThis graphic is titled technical assistance and contains one data table. The table shows VOBA Provided Resources versus the overall average score from survey participants. For more information about the data in this graphic, contact Jackie Dagger, VOREC Program Manager, jackie.dagger@vermont.gov.This graphic is titled Equity and Climate Resiliency and contains one data table and three data points. The table shows the helpfulness of resources to mitigate the impacts to businesses caused by climate change and measures technical assistance resources. The data points share that 58% of respondents do not have a plan, program, or initiative in place to increase workforce diversity. 37% of respondents do not intend to develop a plan, program, or initiative to increase workforce diversity in the next five years. 58% of respondent outdoor businesses were impacted by recent climate events. For more information on the data in this graphic, contact Jackie Dagger, VOREC Program Manager, jackie.dagger@vermont.gov.